IT462 Lab 2: Data warehousing and On-Line Analytic Processing (OLAP)
This lab should get you familiar with use of aggregation and visualization techniques to help you make decisions from your data.
Preliminaries: First, you will need some data to play with. We have populated a wardroom store with
numerous transactions from the 2010-2011 academic year. Download
the wardroomMSSQL.sql file from the
course website, and open it in Microsoft SQL Server 2008 (File->Open Script).
Change the first line of the file to be use
mXXXXXX; where XXXXXX is your alpha, and execute the file. Create a file
named Yourlastname_Lab2.doc. You will be
adding the answers to some questions and a couple of screen shots to it.
The following tables should now be part of your database (primary keys are underlined, foreign keys are italic):
Users(UserID, Password, Type, CompanyNumber)
Products(BarCode, PName, Price)
Orders(OrderID, UserID, Year, Month, Day)
OrderDetails(OrderID, BarCode, Quantity)
PART 1:
Dimensional Modeling
We would like to have a data warehouse and use OLAP to answer questions like:
- What product sold the most items in Company 4?
- What item brought in the most money in Company 3?
- What were the total sales for each company?
- Which was your biggest seller (quantity*price) in March overall?
Use dimensional
modeling to design the structure of the data warehouse. The final result should
have a “star schema”.
Write the answers to the following questions
in yourlastname_Lab2.doc file.
- What is(are) the fact(s)? What is the structure of the fact table?
- Which are the dimensions? What is the structure of each dimension
table?
- Is the fact table in Boyce Codd Normal Form? Justify your answer.
- Are the dimension tables in Boyce Codd Normal Form? Justify your
answer.
PART 2:
Extract-Transform-Load (ETL)
- If any of the fact tables or dimension tables you designed in Part1 is not already created, create it in SQL Server.
Add
the CREATE TABLE statements to create the tables to yourlastname_Lab2.doc file.
- Populate the fact and dimensions tables with data from the original tables. One statement that will be useful for this task in the bulk insert statement (the values to be inserted are the result of a select statement):
INSERT INTO TableName(col1, col2, …)
SELECT col1, col2, … FROM …
Write the statements to populate the tables
into yourlastname_Lab2.doc file
PART 3: Analyze
the data
Part 3.1: Create a connection
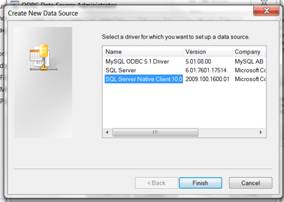
We will need to connect to this wealth of data using an Open Database Connection (ODBC). On XP or Windows7, you find this set up under Control Panel->(System and Security) ->Administrative Tools->Data Sources (ODBC). Click on add, and find the SQL Server Native Client Driver, probably at the bottom of your list.
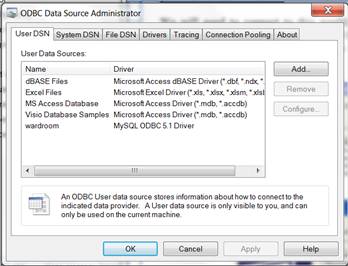
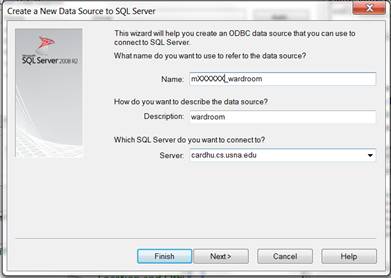
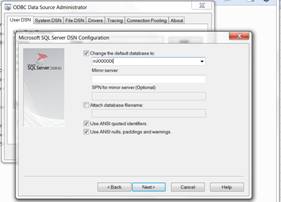
Name the new USER DSN connection mXXXXXX_wardroom where XXXXXX is your
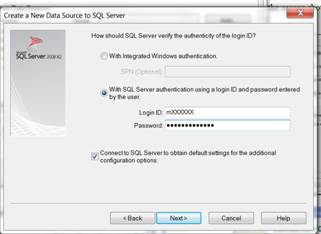
alpha and configure the connection as shown in the screen shots below, using
cardhu.cs.usna.edu, your database, username and password. Change the default
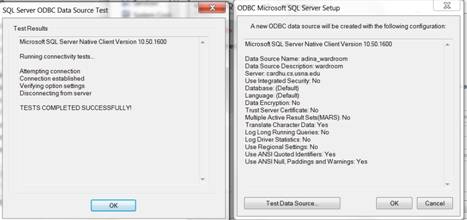
database to be your own database (mXXXXXX instead of master). Leave all other options at their default
values and click “next” until you get a success message.
PART 3.2: Creating
a Pivot Table
Open Excel
(Start->All Programs->Microsoft Office-> Excel) and save the file as
Yourlastname_Lab3.xls. We are going to
create a mechanism to aggregate this dataset and allow you to make some
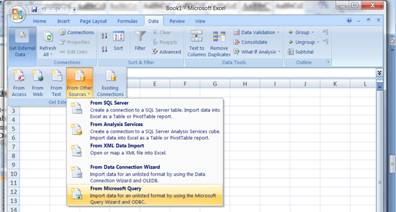
intelligent decisions. Select Data->Get
External Data-From Other Sources ->From Microsoft Query.
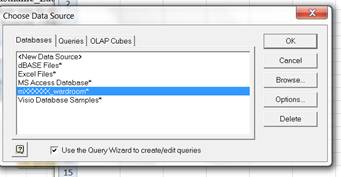
Select the datasource
that you created, mXXXXXX_wardroom and provide a password to connect if asked.
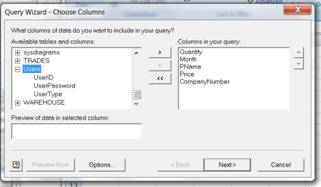
Then select the
columns that you will need for your analysis (see below). In the original
tables, the following columns were of interest. You should select the corresponding
columns in the tables you designed in Part 1 and 2: Orders->Month,
OrderDetails->Quantity, Products->Price, PName and Users->
CompanyNumber. Don’t bother filtering or
sorting the data.
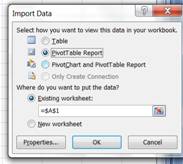
Return the data in Microsoft Office and choose the Pivot Table Report
option when asked.
Now you can play
with the Pivot Table functionality provided by Excel. To do so, you drag and
drop fields listed in the field list into the Filter, Row Labels, Column
Labels, and Values areas. The table below shows quantities obtained by pivoting
on Month and CompanyNumber.

Experiment with the
PivotTable to answer the following questions:
7. What product sold
the most items in Company 4?
8. What item brought
in the most money in Company 3?
9. Which was your
biggest seller (most money) in March overall?
Write all answers to yourlastname_Lab2.doc.
Take a screen shot of the Pivot Table you
used to answer Question 9 and add it to yourlastname_Lab2.doc
10. In SQL Server, write the SQL
SELECT query to obtain the same data as in pivot table in Question 9.
Write your Select
query for to yourlastname_Lab2.doc.
11 (Extra credit). In SQL Server, write the SQL SELECT query
to find the PName of the product that was the biggest seller in terms of money
in March (should obtain the same answer as for Question 9). Write
your Select query to yourlastname_Lab2.doc.
Turn in:
Electronic:
- Upload
the file yourlastname_Lab2.doc to blackboard.
Hard-copies:
- The completed assignment coversheet. Your comments will help us improve the course.
- Hard copy of yourlastname_Lab2.doc