Code submission
Tab separated value (tsv) files
One of the most common applications of programming is processing data. That
means, you have some data at your disposal, and it needs to be analyzed,
summarized, visualized or manipulated into a form that's suitable for some other
data processing tool. Now that you know about loops and file I/O, you're ready
to take on some of these
tasks.
We'll be looking at simple weather data (just temperature) measured at the Naval
Academy, and pulled from the site meteostat. If you pull a week or
less worth of data, you get hour-by-hour data, which is what I want.
- We have all the data for this January, a week at a time (files week1.tsv
through week5.tsv). Obviously, that last file (week 5) has only four days
worth of data in it.
- We also have a file month.tsv that includes all 31 days worth of data.
tsv (tab separated value) files
One of the most important questions you need to ask about data in the digital
world is: what format is the data in? Our data is in a very common
file format called .tsv, for tab separated values. This
means that we have a text file where each row of data is on a single line, and
different fields in a row of data are separated by tab characters, i.e.
'\t'. (Note: we usually assume that fields are not allowed
to contain tabs!.) One nice thing about this format is that spreadsheets
typically can open or import this data.
What week1.tsv looks like
Knowing the file format isn't everything, though. Part of "the format" in
the larger sense is how things are laid out within that file format. In other
words, "OK it's .tsv, but what fields do we have?" If you open week1.tsv using
an editor (e.g., vi or vscode), you will see the following contents:
time	temp
2022-01-01 00:00:00	11.1
2022-01-01 01:00:00	11.3
2022-01-01 02:00:00	11

 ...

2022-01-07 22:00:00	-4.1
2022-01-07 23:00:00	-4.8
|
|
- The first row is literally:
timeTABtemp
-
In the next row:
2022-01-01 00:00:00TAB11.1
[date]     [time]     temperature (°C)]
|
Part 0: Preparation
This lab is about processing data files, so you are going to need
some data files to get started on.
- Make a directory
lab04
- cd into the
lab04 directory
- Download data.tgz into your
lab04.
-
Unpack files (month.tsv week1.tsv week2.tsv week3.tsv
week4.tsv week5.tsv) with:
tar xfz data.tgz
Note: if you do an ls you should see month.tsv week1.tsv week2.tsv week3.tsv
week4.tsv week5.tsv listed.
-
Important: Be sure to open and check week1.tsv (and other files) in a
text editor to get the feel of them.
Part 1: Summarize with average (part1.cpp)
First we will summarize the data by printing the average
temperature over the dataset in Fahrenheit. Note that
this requires conversion since the raw data is in Cesius.
Use the formula $T_F = \frac{9}{5}T_C + 32$.
You will write a program called
part1.cpp that reads a file name from
the user, then gives the average temperature across all the
entries in the data file.
Sample runs:
| run 1 |
run 2 |
run 3 |
$ ./part1
weak1.tsv
Could not open file 'weak1.tsv'
$ echo $?
1 |
$ ./part1
week1.tsv
file: week1.tsv
ave: 40.0904
|
$ ./part1
week5.tsv
file: week5.tsv
ave: 26.5225
|
Tips:
- If your program doesn't work correctly, first check if your program correctly
reads all temperatures. Try to cout them.
- Type matters, especially when you perform divisions.
File open failure
If the data file does not exist, you must print an error message in the format
described below, and return 1 rather than 0 from main() to indicate an error.
-
echo $? is a UNIX command that
displays the value returned by the previous program run in the shell.
Part 2: Min and max (part2.cpp)
In the world of weather, everyone is interested in the extremes.
Create a new program part2.cpp
that builds on your Part 1 solution by reporting the min and max temperatures
along with the day (report the first occurrence if there are ties) on which
those temperatures occurred.
| run 1 |
run 2 |
run 3 |
$ ./part2
weak1.tsv
Could not open file 'weak1.tsv'
$ echo $?
1 |
$ ./part2
week1.tsv
file: week1.tsv
ave: 40.0904
min: 23.36 on 2022-01-07
max: 64.58 on 2022-01-01 |
$ ./part2
week2.tsv
file: week2.tsv
ave: 33.1282
min: 20.3 on 2022-01-08
max: 47.66 on 2022-01-09 |
Part 3: Output a .tsv file suitable for use with a spreadsheet (part3.cpp)
Often we write programs to convert data in one format to another
format that fits a tool we want to use. Create a new program
part3.cpp that builds on your Part 2
solution by writing a .tsv file (the name is given by the user)
that contains the same time&temp data as the input, with
three differences:
dayTABhourTABtemp
2022-01-29TAB1TAB30.2
2022-01-29TAB2TAB30.2
...
|
|
Each data row has three parts:
- date: this field is the same as the date in the input tsv file (e.g., 2022-01-29)
- hour: the hh:mm:ss format of the input file should be converted into the
hour of the day in the range 1,2,...,24. For example,
- 00:00:00 → 1
- 01:00:00 → 2
- 23:00:00 → 24
- Temperatures are in Fahrenheit rather than Celsius.
|
| run 1 |
run 2 |
run 2 (cont.) |
$ ./part3
weak1.tsv out1.tsv
Could not open file 'weak1.tsv'
$ echo $?
1 |
$ ./part3
week5.tsv out5.tsv
file: week5.tsv
ave: 26.5225
min: 15.8 on 2022-01-30
max: 33.8 on 2022-01-31
output in: out5.tsv |
File out5.tsv produced by run 2.
You can open this (and your output) in a spreadsheet
like libreoffice. You can also view it in the terminal
like this:
$ cat out5.tsv
day	hour	temp
2022-01-29 1	30.2
2022-01-29 2	30.2
···
2022-01-31 22	30.2
2022-01-31 23	30.2
2022-01-31 24	28.4
|
Open out5.tsv in a spreadsheet
If you created the file out5.tsv
(like above), then on the lab machines the command
libreoffice out5.tsv& will automatically
import the tsv file into a spreadsheet. Try running on several of the
input files and opening them in a spreadsheet.
Part 4: Going further, reformatting the data to plot in a spreadsheet
For this part, we would like to reformat the data to allow a
spreadsheet-user to analyze patterns a day-at-a-time.
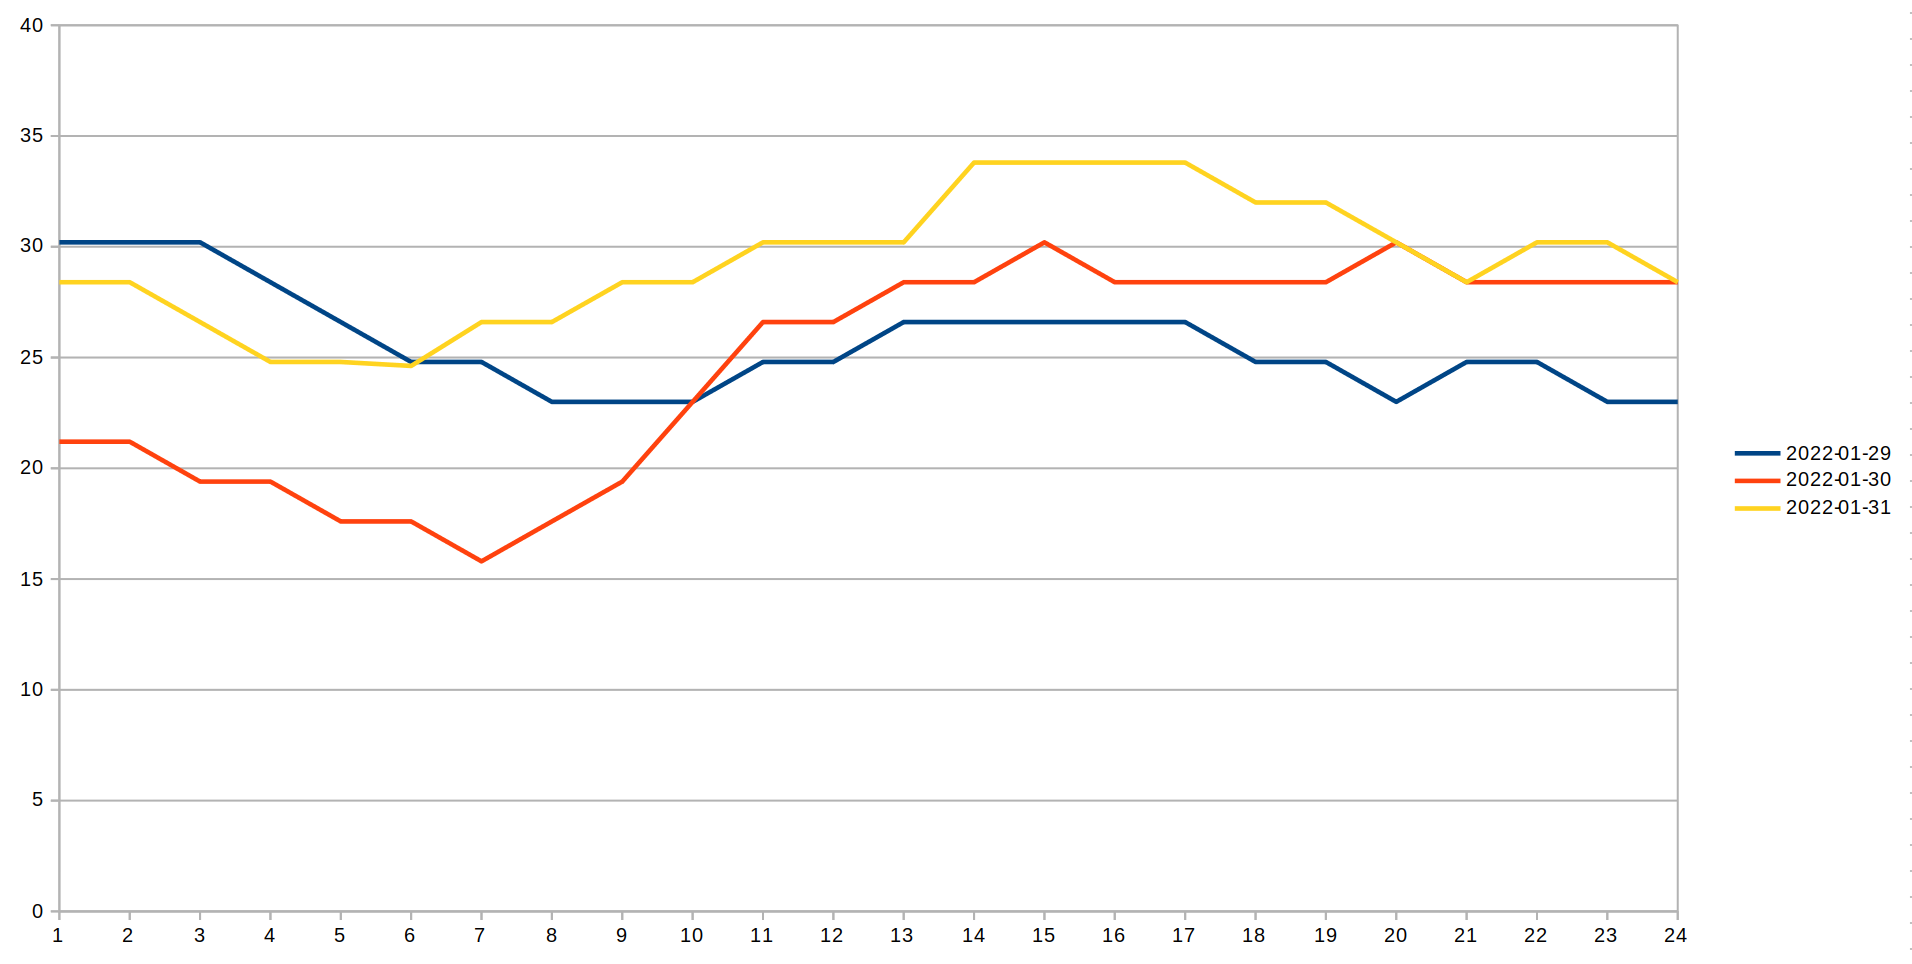
Example: Plotting out5NEW.tsv in Libreoffice
- Download out5NEW.tsv.
- In Libreoffice (the spreadsheet program in the VM), open
out5New.tsv.
- Drag your mouse to choose all the entries in the spreadsheet (all entries
from location A1 to location Y3).
- Choose
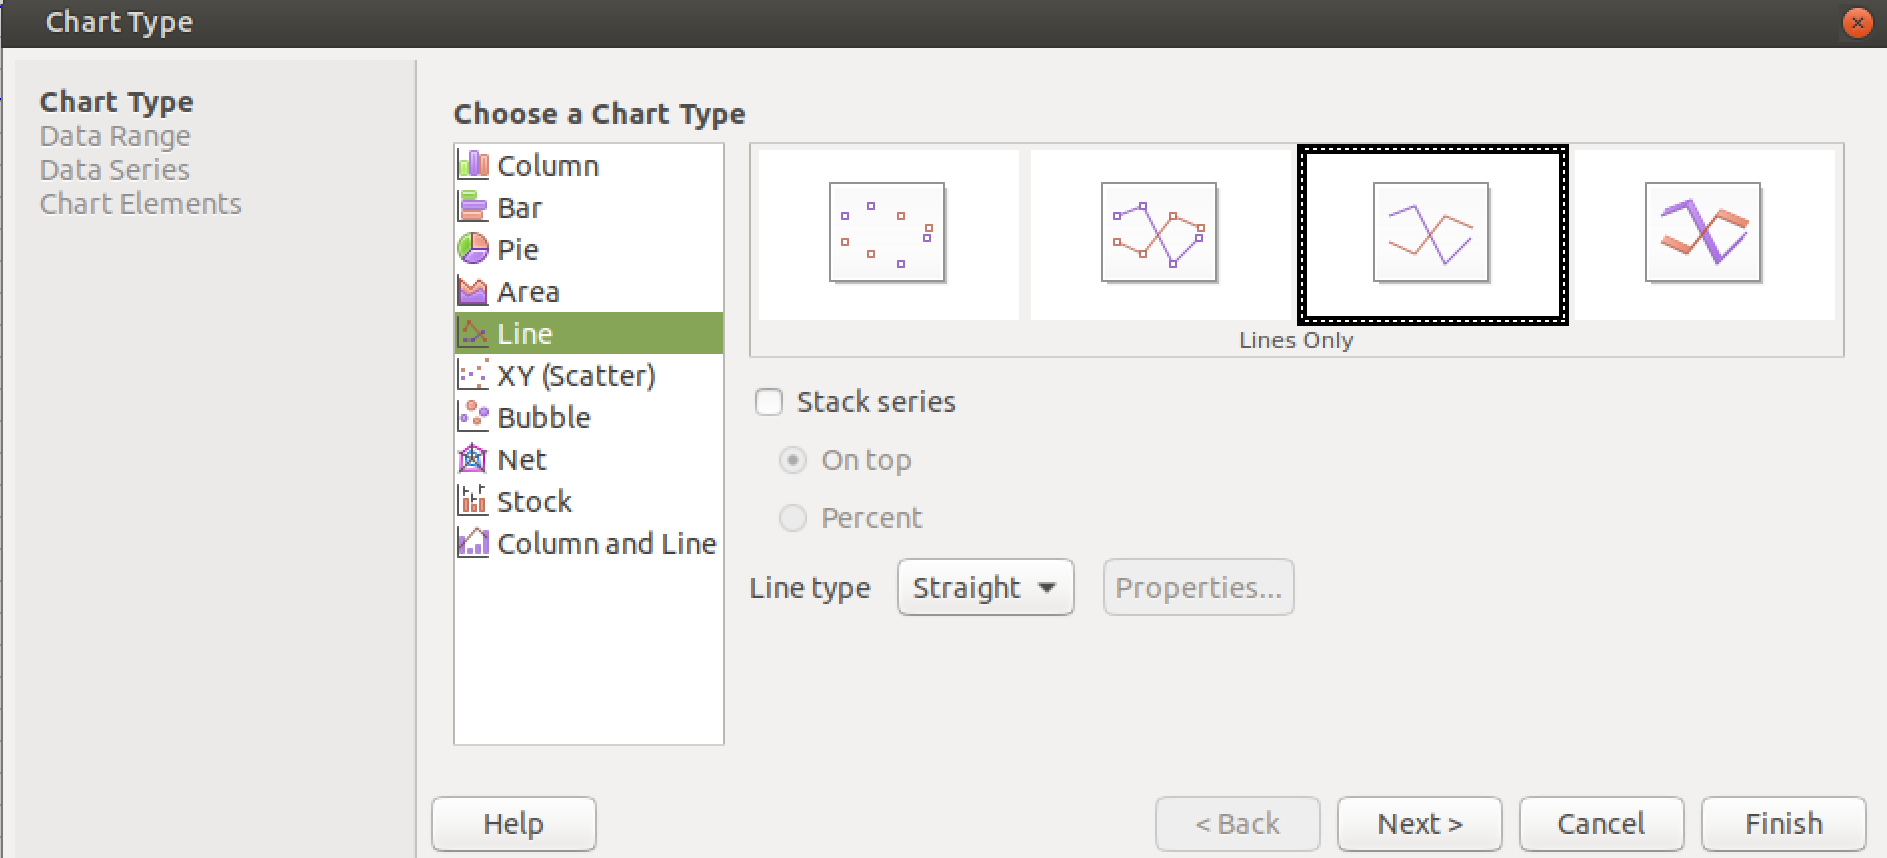
Insert → Chart
- For Chart Type, choose a line chart with lines only.
- For Data Range,
- Double check if the data range covers locations from A1 to Y3.
- Choose "Data series in rows"
- Choose "First column as label"
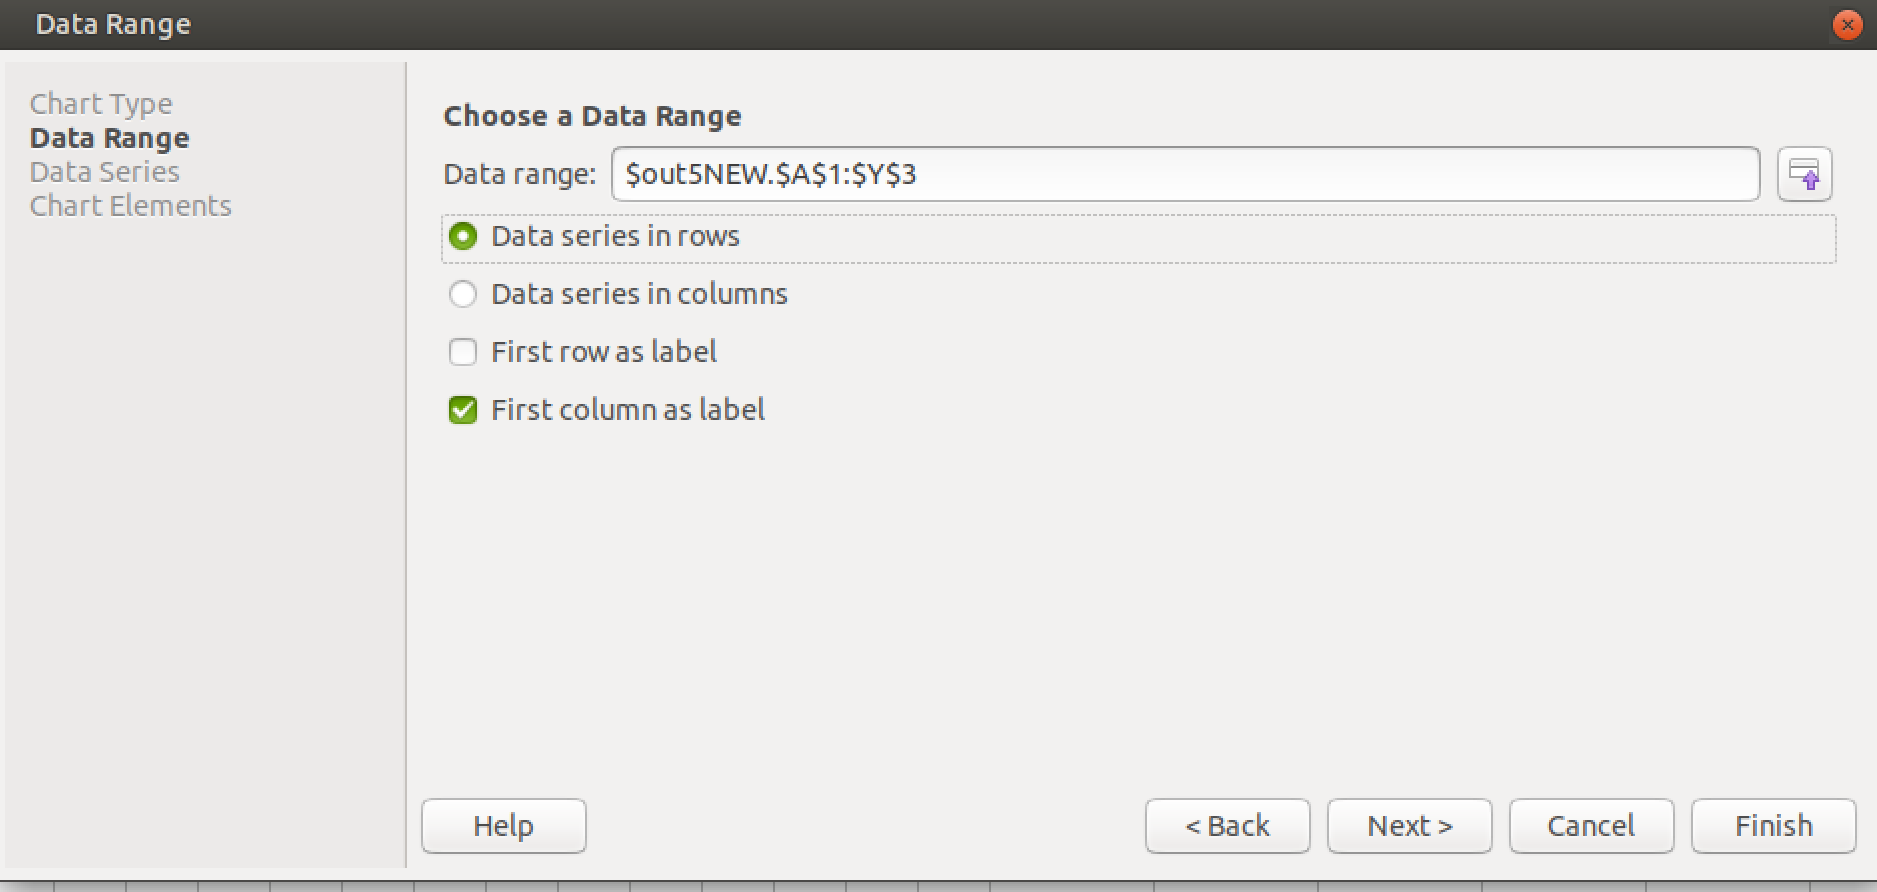
- For the rest, click Next or Finish.
The plot of will look like the following:
Your Task
Like
out5NEW.tsv, we would like a .tsv file where
each row represents
one day's data rather than a single hour's
temperature.
-
There should be no header row.
- Each row will consist of the day's date
(e.g.
2022-01-29) followed by a field with the
temperature from the first hour, then a field with the temperature
from the second hour, all the way up to a field for the 24th hour.
| run 1 |
contents of out5.tsv (part3) | contents of
out5NEW.tsv (this part) |
$ ./part4
week5.tsv out5NEW.tsv
file: week5.tsv
ave: 26.5225
min: 15.8 on 2022-01-30
max: 33.8 on 2022-01-31
output in: out5NEW.tsv |
day	hour	temp
2022-01-29 1	30.2
2022-01-29 2	30.2
···
2022-01-31 23	30.2
2022-01-31 24	28.4

2022-01-29TAB30.2TAB30.2TAB    ...
2022-01-30TAB   ...
2022-01-31TAB   ...      TAB30.2TAB28.4
|
|
Check the trends!
Run your program on week1.tsv and plot the results. Then do the same for
week2.tsv and plot the results. See any trends? If you run it on month.tsv you
can plot the 24-hour temperature curve for all the days in the month. It's
interesting to look at!