A common case of when you'll want to create a quick program is if you receive a bunch of data in a structured format, but the data is far too big to manually understand. Spreadsheets and Excel are usually the layman's default answer, but even Excel is limited to one analysis at a time.
In today's lab, you will write a computer program that processes data about food production in middle-to-low income countries. Imagine yourself as an international long-term threat expert within the Navy. You've been given 7MB of data, way too much to go through by hand. Thankfully you took this class! You will write a program to create graphs of country food production trends for quick analysis.
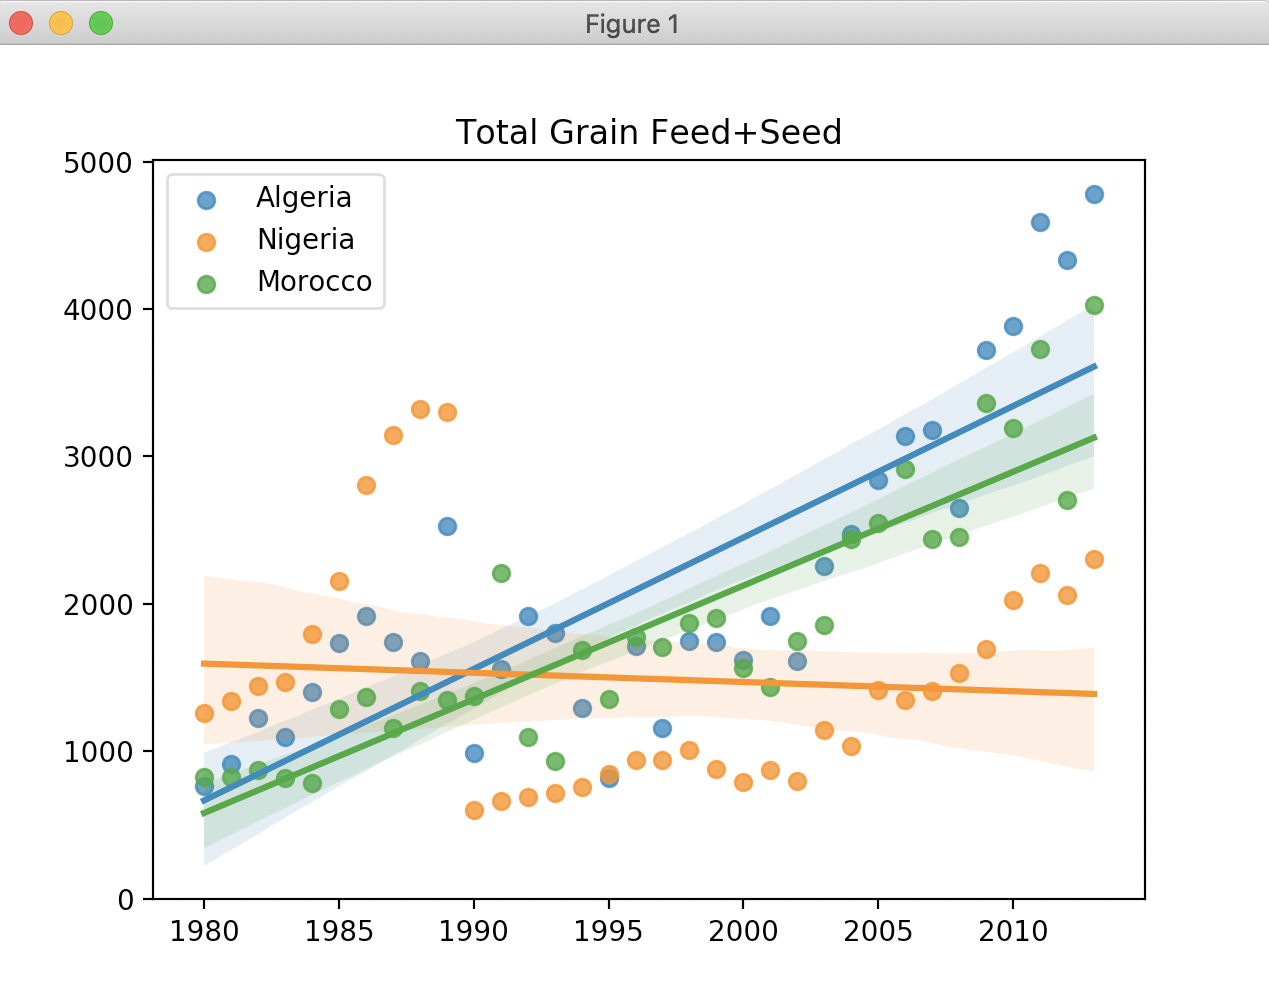
7MB of data, and look at that graph on the right. You should already see something interesting pop off the graph (hint: Nigeria in 1990). Computer programming is great!
Visit the US Dept of Agriculture's page on international food security. Download the CSV file (scroll down, CSV File). CSV stands for comma-separated values. This is a very common file format that all modern spreadsheet tools can generate.
For graph visualization, we will use Python's very popular Matplotlib library. Matplotlib's graphs are a little boring, though, so we'll use the complementary Seaborn library for nicer looking Matplotlib graphs. Thus, you have two libraries to install:
sudo apt-get install python3-matplotlib
pip3 install seabornWe haven't talked about reading text data from files, but it's pretty straightforward. In fact, here are 2 lines of code that opens a file and reads in every line to a list:
with open('data.txt', errors='replace') as f:
   lines = f.readlines()
Do not skip understanding this. This code opens a text file named "data.txt", and then it reads the lines into a List. We know all about lists, right? The variable lines is a List of strings where each string is one line of the file.
Create a file called lines.py. You are ready to take your first step. Write a program that asks the user for a filename, and then prints out the 10th line in the gfa25.csv file you downloaded above. You should match this output exactly:
Filename: gfa25.csv
Algeria,Total Grains/Cereals,Import Quantity,1000 MT,1980,3413.81
Now continue on and change your program to print only the lines that match "Somalia" and that also contain the value "Feed + Seed". Your output should match:
Filename: gfa25.csv
Somalia,Total Grains/Cereals,Feed + Seed,1000 MT,1980,16.986

Somalia,Root Crops (R&T),Feed + Seed,Grain Equiv. 1000 MT,1980,0

Somalia,Total Grains/Cereals,Feed + Seed,1000 MT,1981,17.83

Somalia,Root Crops (R&T),Feed + Seed,Grain Equiv. 1000 MT,1981,0

Somalia,Total Grains/Cereals,Feed + Seed,1000 MT,1982,13.636

Somalia,Root Crops (R&T),Feed + Seed,Grain Equiv. 1000 MT,1982,0

Somalia,Total Grains/Cereals,Feed + Seed,1000 MT,1983,17.886

Somalia,Root Crops (R&T),Feed + Seed,Grain Equiv. 1000 MT,1983,0

Somalia,Total Grains/Cereals,Feed + Seed,1000 MT,1984,16.465

Somalia,Root Crops (R&T),Feed + Seed,Grain Equiv. 1000 MT,1984,0

Somalia,Total Grains/Cereals,Feed + Seed,1000 MT,1985,15.597

Somalia,Root Crops (R&T),Feed + Seed,Grain Equiv. 1000 MT,1985,0

Somalia,Total Grains/Cereals,Feed + Seed,1000 MT,1986,18.693

Somalia,Root Crops (R&T),Feed + Seed,Grain Equiv. 1000 MT,1986,0

Somalia,Total Grains/Cereals,Feed + Seed,1000 MT,1987,20.538

Somalia,Root Crops (R&T),Feed + Seed,Grain Equiv. 1000 MT,1987,0

Somalia,Total Grains/Cereals,Feed + Seed,1000 MT,1988,19.774

Somalia,Root Crops (R&T),Feed + Seed,Grain Equiv. 1000 MT,1988,0

Somalia,Total Grains/Cereals,Feed + Seed,1000 MT,1989,17.85

Somalia,Root Crops (R&T),Feed + Seed,Grain Equiv. 1000 MT,1989,0

Somalia,Total Grains/Cereals,Feed + Seed,1000 MT,1990,40

Somalia,Root Crops (R&T),Feed + Seed,Grain Equiv. 1000 MT,1990,0

Somalia,Total Grains/Cereals,Feed + Seed,1000 MT,1991,10

Somalia,Root Crops (R&T),Feed + Seed,Grain Equiv. 1000 MT,1991,0

Somalia,Total Grains/Cereals,Feed + Seed,1000 MT,1992,20

Somalia,Root Crops (R&T),Feed + Seed,Grain Equiv. 1000 MT,1992,0

Somalia,Total Grains/Cereals,Feed + Seed,1000 MT,1993,5

Somalia,Root Crops (R&T),Feed + Seed,Grain Equiv. 1000 MT,1993,0

Somalia,Total Grains/Cereals,Feed + Seed,1000 MT,1994,15

Somalia,Root Crops (R&T),Feed + Seed,Grain Equiv. 1000 MT,1994,0

Somalia,Total Grains/Cereals,Feed + Seed,1000 MT,1995,15

Somalia,Root Crops (R&T),Feed + Seed,Grain Equiv. 1000 MT,1995,0

Somalia,Total Grains/Cereals,Feed + Seed,1000 MT,1996,10

Somalia,Root Crops (R&T),Feed + Seed,Grain Equiv. 1000 MT,1996,0

Somalia,Total Grains/Cereals,Feed + Seed,1000 MT,1997,10

Somalia,Root Crops (R&T),Feed + Seed,Grain Equiv. 1000 MT,1997,0

Somalia,Total Grains/Cereals,Feed + Seed,1000 MT,1998,6

Somalia,Root Crops (R&T),Feed + Seed,Grain Equiv. 1000 MT,1998,0

Somalia,Total Grains/Cereals,Feed + Seed,1000 MT,1999,10

Somalia,Root Crops (R&T),Feed + Seed,Grain Equiv. 1000 MT,1999,0

Somalia,Total Grains/Cereals,Feed + Seed,1000 MT,2000,15

Somalia,Root Crops (R&T),Feed + Seed,Grain Equiv. 1000 MT,2000,0

Somalia,Total Grains/Cereals,Feed + Seed,1000 MT,2001,13

Somalia,Root Crops (R&T),Feed + Seed,Grain Equiv. 1000 MT,2001,0

Somalia,Total Grains/Cereals,Feed + Seed,1000 MT,2002,19

Somalia,Root Crops (R&T),Feed + Seed,Grain Equiv. 1000 MT,2002,0

Somalia,Total Grains/Cereals,Feed + Seed,1000 MT,2003,14

Somalia,Root Crops (R&T),Feed + Seed,Grain Equiv. 1000 MT,2003,0

Somalia,Total Grains/Cereals,Feed + Seed,1000 MT,2004,13

Somalia,Root Crops (R&T),Feed + Seed,Grain Equiv. 1000 MT,2004,0

Somalia,Total Grains/Cereals,Feed + Seed,1000 MT,2005,8

Somalia,Root Crops (R&T),Feed + Seed,Grain Equiv. 1000 MT,2005,0

Somalia,Total Grains/Cereals,Feed + Seed,1000 MT,2006,14

Somalia,Root Crops (R&T),Feed + Seed,Grain Equiv. 1000 MT,2006,0

Somalia,Total Grains/Cereals,Feed + Seed,1000 MT,2007,8

Somalia,Root Crops (R&T),Feed + Seed,Grain Equiv. 1000 MT,2007,0

Somalia,Total Grains/Cereals,Feed + Seed,1000 MT,2008,14

Somalia,Root Crops (R&T),Feed + Seed,Grain Equiv. 1000 MT,2008,0

Somalia,Total Grains/Cereals,Feed + Seed,1000 MT,2009,17

Somalia,Root Crops (R&T),Feed + Seed,Grain Equiv. 1000 MT,2009,0

Somalia,Total Grains/Cereals,Feed + Seed,1000 MT,2010,17

Somalia,Root Crops (R&T),Feed + Seed,Grain Equiv. 1000 MT,2010,0

Somalia,Total Grains/Cereals,Feed + Seed,1000 MT,2011,15

Somalia,Root Crops (R&T),Feed + Seed,Grain Equiv. 1000 MT,2011,0

Somalia,Total Grains/Cereals,Feed + Seed,1000 MT,2012,12

Somalia,Root Crops (R&T),Feed + Seed,Grain Equiv. 1000 MT,2012,0

Somalia,Total Grains/Cereals,Feed + Seed,1000 MT,2013,17
Copy your lines.py to graph.py. You will now change your program to do the following:
In order to generate a scatterplot, we need two lists. The first list is the x-values, and the second list is the y-values. If you take our Somalia example from above, the lists look like this when printed out:
years [1980, 1981, 1982, 1983, 1984, 1985, 1986, 1987, 1988, 1989, 1990, 1991, 1992, 1993, 1994, 1995, 1996, 1997, 1998, 1999, 2000, 2001, 2002, 2003, 2004, 2005, 2006, 2007, 2008, 2009, 2010, 2011, 2012, 2013]
counts [16.986, 17.83, 13.636, 17.886, 16.465, 15.597, 18.693, 20.538, 19.774, 17.85, 40.0, 10.0, 20.0, 5.0, 15.0, 15.0, 10.0, 10.0, 6.0, 10.0, 15.0, 13.0, 19.0, 14.0, 13.0, 8.0, 14.0, 8.0, 14.0, 17.0, 17.0, 15.0, 12.0, 17.0]
Obviously, in order to get these numbers out of those CSV lines, you will need to pull apart those lines. We've done this a couple times now with strings. We frequently use the str.split(' ') function to split a string on spaces into a list of individual strings. Change the space argument to be whatever is appropriate for this task.
Your job: write code to create these two lists from the CSV lines you printed in Step 1! We only show you this output to help you debug, but we don't need you to print them out. You will create these two lists, and then use a handy-dandy graphing library!
Seaborn is a cool graphing library that was built around the popular Matplotlib library which is very powerful, but less cool looking. There are lots of graphing options available in Python. Ok how do we use it? Here is an example:
import matplotlib.pyplot as plt
import seaborn as sns

x_list = [ 1, 2, 4, 5, 6 ]
y_list = [ 3, 4, 5, 6, 7 ]
# "Regression Plot" to plot your data points, and then fit a line to it.
sns.regplot(x_list, y_list, label="Legend Name")

# Final code to generate the details of the plot
plt.legend()  # shows the legend!
plt.title('Give It a Title')
plt.show()   # finally pops it up
Did you try it? Create a test.py and paste this in. Run it. Cool right?
Ok we're done showing you stuff. We showed you how to graph some points. We showed you how to read in lines. Now you just put the two together. Process the lines to create two lists of x,y values, and then graph it.
Required: you will turn in graph.py which does the two steps:
Copy your graph.py to graphs.py. The last piece is to make this more useful as an interactive tool.
Allow the user to enter more than one country at once, separated by commas. You will graph all the countries they enter on the same graph. This is actually pretty easy with sns.regplot(x_list, y_list, label="Legend Name"). If you call regplot twice with different data, it will show them on the same graph. Call it N times in a row, and it will have N colored lines.
Your behavior should look like this:
Filename: gfa25.csv
Countries: Algeria,Nigeria,Morocco
The generated graph should look exactly like the one at the very top of this page. It goes without saying that your program should work for any number of countries, including just one.
Finally, make it a loop so that the user can close the graph and then enter a new query without typing in the file again. Like so:
Filename: gfa25.csv
Countries: Algeria,Nigeria,Morocco
Countries: Sudan
Countries: Laos,Nigeria
Countries: quit
The user will hit the X on the graph to close it and get the next prompt.
Required: you will turn in graphs.py which behaves as specified above.
Change your program to allow the user to alter category and desired age range with commands:
Filename: gfa25.csv
Countries: Sudan,Zimbabwe
Countries: cat Root Crops
Countries: type Import
Countries: Sudan,Zimbabwe
Countries: quit
The first graph will be the same, but the second of Sudan/Zimbabwe should now show lines for Imports of Root Crops.
If you did that quickly, it means you used good coding practices with variables. Now make an "ALL" option that displays the line for all countries:
Filename: gfa25.csv
Countries: cat Root Crops
Countries: type Import
Countries: ALL
Countries: quit
That should show a crazy full graph. Which countries have actually been declining in imports? Try some other categories, what changes?
Did you learn something today? Hooray!
Make sure you have good comments in your code before submitting.
Visit the submit website and upload lines.py, graph.py, graphs.py file to Lab05 for grading.